Market Technical View is a blog that mostly concerns the technical analysis of different financial instruments like indices, commodities, stocks, ETFs and currencies.

All the posts are structured in 3 main chapters that can be found in Content, in the upper right-hand corner of the blog.

Market perspective. The technical approach consists of chart patterns and important support/resistance zones. The purpose of this section is to give directions of the price on short and medium term (a few days up to a few months).

Trading setups. The analysis posted here will provide trading scenarios based on different technical tools.

Romanian Market. This is a section dedicated to Romanian stocks and indices.

Search This Blog

Friday, February 17, 2012

DJI Index technical analysis

The Dow Jones Industrial Average Index is trading within a range for more than two weeks now and the eventual break in each direction will provide the market direction on the very short term.

The main support zone is between the $12,750 and $12,800 while the resistance level is in the $12,900 area.

On the medium term the market is evolving within a bullish channel and its borders represent support and resistance for the price.  


Bank of America bullish engulfing pattern

Bank of America reversed at the support level of $7.65 and, along with the previous candle, a bullish engulfing candle pattern has formed.

If there won’t be any important news that could influence this stock, the previous target of $8.40-$8.90 could be achieved but if the $7.65 support level is considered as a stop loss, the risk/reward ratio is not satisfactory. 

Previous analysis: 


Alcoa bullish scenario for short-term traders

Alcoa reversed at the support level of $10.00 and for the short term investors a ride towards the $10.86-$11.20 could turn into a profitable transaction, with a good risk/reward ratio.

However, the investors should pay attention to any kind of news related to the Greek debt bailout plan that could reverse the market in a matter of minutes.


SIF Transilvania (SIF3) Technical Analysis 2012.02.17

The SIF3 shares price is maintaining in the ascending narrow channel even if during the last session was trading at lower levels (intraday).

On mid-term (few months) the most important support zone is given by the T1 trend line and by the levels of 0.6100-0.6300 RON and in case that this will be broke, the chances of a broad correction will increase considerably.

For investors who follow a purchase, the best area would be the 0.6100-0.6300 RON area because it offers a very good risk/reward ratio. The stop loss level can be considered below the support level of 0.6100 RON (it can take into consideration the T1 trend line also) and the increasing possibility will be given by the previous highs from the 0.6730 RON area.


Banca Transilvania (TLV) Tehnical Analysis 2012.02.17

The rally that started on December 20 seems exhausted at the level of 50% Fibonacci retracement compared to 2011 decline (May-December) and the price evolution from the last sessions shows the bears domination (at least temporary). 

The 1.0000-1.0100 RON area represents a support for the price and in case that it will be broke, the price can reach very quickly in the area of 0.9500 RON/share.

For investors with high risk approach, the 1.0100 RON area represents a good zone for purchase, with target in the last highs area (1.0650 RON level).


BRD-Groupe Societe Generale (BRD) Technical Analysis 2012.02.17

The closing below the support level of 11.00 RON generated a sell signal for BRD securities which have free path in the previous lows areas from the 10.00 RON level.

The bulls failed to take the price above the 11.50 RON area in the previous weeks, thus showing the weakness of the upward movement.  

The first resistance is now the 11.00 RON level (the former support).


Thursday, February 16, 2012

Crude Oil (WTI) Technical Analysis 2012.02.16

WTI Crude Oil hit the $102.00 resistance yesterday on the news that Iran stopped delivering oil for 5 European countries.

However, the news was quickly faded and the price consolidated around $101.50 until the Crude Oil Inventories at 15:30 GMT. The

The trend for today was bearish and the $101.30 level was the most important as the price broke and retested it. There are high chances of a broader correction in the future days, targeting the zone between the Fibonacci retracements of 38.2%($100.37) and 61.8%($99.30). 


S&P 500 Technical Analysis 2012.02.16

The last 8 sessions of S&P 500 oscillated in the $1,340-$1,354 horizontal channel and shoes the investors’ indecision regarding the market perspective.

In case of a correction, the most important support zone is between 1,331 and 1,340 levels, as stated in the previous analysis (http://markettechnicalview.blogspot.com/2012/02/s-support-levels-to-watch-1340-and-1331.html ). 

The bearish scenario will trigger if the current support zone will be breached. If so, than a sharp throwback is possible in order to retest the T1 trend line before the market will head towards the support levels from $1.3000, $1,280 and $1,260.


OMV Petrom (SNP) Technical Analysis 2012.02.16

The target given in the analysis from 13 February (http://www.goldring.ro/omv-petrom-(snp)-analiza-tehnica.html ) was reached during the Tuesday’s session and the support from the 0.3650 level (Fibonacci 50%) was broke in the previous session.

Further, on short term, a correction with support in 0.3300-0.3440 RON area is probably. To establish the daily resistance it can be consider the highs of previous sessions.

February volumes down support a correction in the next period.


SIF Muntenia (SIF4) Technical Analysis 2012.02.16

The previous session, down by 2.86%, show the negative sentiment investors and enhances the chances of a correction for the next period. 

The daily resistance is established at 0.7880 RON level and the support remains the same from the previous analysis (http://markettechnicalview.blogspot.com/2012/02/sif-muntenia-sif4-technical-analysis.html), at 0.6930 RON level.

SIF Banat-Crisana (SIF1) Technical Analysis 2012.02.16

The previous session of SIF Banat-Crisana (SIF1) issuer generated a sell signal because of price decline below the active support from the 1.2150 RON level.

The resistance area for the next sessions is between levels of 1.2150 and 1.2450 RON and the target for correction (decrease) is given by the large support area of 1.0070-1.0770 RON.

The international markets evolution and the discussions on bailout plan of Greece will have an important say and in case of Romanian market.


Wednesday, February 15, 2012

S&P support levels to watch: $1,340 and $1,331

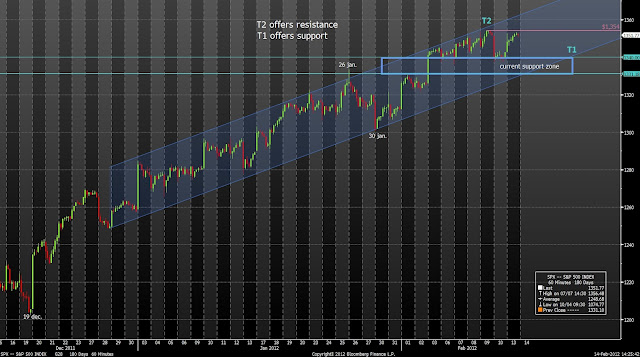
The main support on the S&P Index still stands in the $1,331-$1,340 area after Tuesday’s session.

The closest resistance is represented by the highs of the previous days, in the $1,354 area and the mid-term bullish channel is framing the market. 

Even if the resistance will be breached, the fail to reach the T2 resistance line will prove the bullish weakness and an eventual break of the lower border of the channel will set the market for further decline, at least on the short term.


Bank Of America: bulls are weak

Bank of America shares failed again to reach the $8.40 target and dropped by more than 3.00% on Tuesday’s session.
The first target on the eventual correction stands at $7.65 and the Greek problems could influence the whole market, including the banking sector.

For those who bought at the break of the falling wedge (http://markettechnicalview.blogspot.com/2012/01/bank-of-america-broke-important-trend.html) a profit taking would be advisable.


Alcoa support at $10.00

The buyers of Alcoa shares failed to reach the $11.20 target, pointing out their weakness (at least temporary) in front of the bears.

The last few trading days took the price to the first support in the $10.00 area and further obstacles in the Eurozone discussions related to Greece could influence the whole market. 


SIF Oltenia (SIF5) - Analiza Tehnica

The SIF Oltenia (SIF 5) shares price reached in the previous session the formed resistance from the upper limit of the ascending channel and the horizontal level of 1.4500 RON.

There is the possibility of a correction with the first support area between levels of 1.3240 RON and 1.3580 RON which will depend largely and of the European markets evolution.


SIF Moldova (SIF2) - Analiza Tehnica

SIF Moldova (SIF2) recovered the entire decline from March-October of the last year and in terms of technically, the 1,5000 RON area represent a resistance.

On mid-term (last 4 months) the increasing trend is characterized by the T2 trend line and the closest support area is between levels of 1.3500 and 1.4000 RON.

The buying at these levels must be cautious because a markup of some profits will led to a correction, at least in the short term.


BRD - Analiza Tehnica

Although the BRD shares price decreased in the last trading session, the final return and the support offered by the 11.00 RON level maintain the probability of short and mid-term increasing. 

The local highs from December and January turned into support for the price and, the investor's interest for BRD securities at 11.00 RON level show the increasing capacity.

The first resistance is now in the 11.50 RON area and an eventual brake will come as a confirmation for the target from the 12.00 RON level.


Tuesday, February 14, 2012

S&P 500 support and resistance

S&P Index is still moving in the bullish channel started in late December and its borders are regarded by investors as relevant support and resistance.

The most important support zone in case of a drop in this session stand between $1,331 and $1,340 levels and it represents recent local highs and lows.

The main resistance is close to Friday’s closing level, at $1,354 and if it will breached, the buyers may take the price towards the T2 trend line. An eventual fail of the bulls to break the above mentioned resistances will show the bear domination, at least for today. 


JP Morgan Chase (JPM) - technical analysis

JP Morgan made a double bottom in the autumn of 2011 and managed to break above the base level at $36.63 a few weeks ago.

The classic target of a double bottom is in the $45.00 area but an eventual break below the current support at $36.63 will invalidate, at least for the moment, the target.

The most concerning clue that is against the bullish move is the descending volumes in the last months.  


IBM share price ready for a new move

IBM share price reached the highs of December ($194.90) a couple of weeks ago and is trading in a narrow range, between $191.40 and $194.90 levels.

The volumes descended in the month of February, reflecting the short term consolidation period. The longer term perspective (http://markettechnicalview.blogspot.com/2012/01/ibm-shares-price-in-clear-up-trend.html) shows a clear bullish channel where the borders are acting as support and resistance.

If the prices will break below the $190.00-$194.90 support area without breaking the $194.90 resistance before (showing bulls failure), the market has a clear path towards the T1 trend line and $177.34 support.


Monday, February 13, 2012

Crude Oil (WTI) Technical Analysis

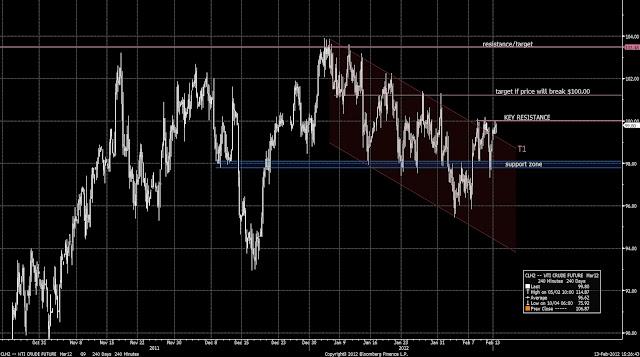
The Crude Oil (WTi) has tested the $100.00 resistance for 3 times in the last four sessions, putting some kind of bullish pressure on the market.

Although the Greek accord signed last night and IEA projections of lower demand have a bearish impact on crude prices, the bulls could be tempted if the price will break above the key resistance level of $100.00.  

The mid-term outlook shows a down sloping channel started in early January which can turn out to be just a corrective move for the larger rising trend. If this will be the case, Crude Oil can hit $103.50 target in a matter of days but this move will have to be sustained by strong fundamentals.

The first target in case of a break above $100.00 level is the $101.20 area that marks previous highs and lows.


Bank Of America reacted to $8.40 resistance

Bank of America made a high last week close to the target of $8.40 that was given in early January (http://markettechnicalview.blogspot.com/2012/01/bank-of-america-broke-important-trend.html) .

The first support is now at $7.64 and this can be the sell signal for those who want to keep their positions.


BET-FI Technical Analysis 2012.02.13

BET-FI Index closed the last session of the week at 24.412 level, in slight decrease, thus maintaining in the 24.500-25.000 resistance area, marked in the previous analysis.
http://markettechnicalview.blogspot.com/2012/02/bet-fi-technical-analysis-20120206.html)

Further, if the situation of the international markets will get worse, it is expected that investors to mark some their profits, thus generating a correction.

The first support is given by 24.000 level but, in the case of a correction, the first target zone is between 22.700-23.000 levels.


Erste Group Bank (EBS) Technical Analysis 2012.02.13

The last 3 trading sessions created a sell signal for Erste Bank Group shares.

The first target given yet since January (http://markettechnicalview.blogspot.com/2012/01/analiza-tehnica-erste-group-bank-ebs.html) was missed by a little on Thursday session and is still a resistance for the price.

The 80.00 RON level still remains an active support and can be consider a sell signal in case that it will be breached. The 60.20-69.70 RON area it is established as a stronger support and as a target to decrease in case of a short term correction (within a few weeks).


BRD-Groupe Societe Generale (BRD) Technical Analysis 2012.02.13

BRD securities were traded down in Friday’s session and in the end the buyers managed to maintain the price relatively high.
The given support in the previous analysis (http://markettechnicalview.blogspot.com/2012/02/brd-groupe-societe-generale-brd_03.html), has been observed at 11.32 RON level and the target is maintained at 12.00 RON level.

The first resistance is maintained at 11.60 RON level, but the investors must be carefully to the international market evolution and especially the banking sector.